
Future Nobel Prize winners both. Kamerlingh Onnes and Johannes van der Waals in 1908.
On Friday 10 July 1908, at Leiden in the Netherlands, Kamerlingh Onnes succeeded in liquefying the one remaining gas previously thought to be non-condensable – helium – using a sequential Joule-Thomson cooling technique to drive the temperature down to just 4 degrees above absolute zero. The event brought to a conclusion the race to liquefy the so-called permanent gases, following the revelation that all gases have a critical temperature below which they must be cooled before liquefaction is possible.
This crucial fact was established by Dr. Thomas Andrews, professor of chemistry at Queen’s College Belfast, in his groundbreaking study of the liquefaction of carbon dioxide, “On the Continuity of the Gaseous and Liquid States of Matter”, published in the Philosophical Transactions of the Royal Society of London in 1869.
As described in Part I of this blog post, Andrews’ discovery of the critical temperature (aided and abetted by Joule and Thomson’s earlier discovery of isenthalpic cooling) opened the way to cryotechnological advances of great commercial importance, and gave birth to the industrial gases industry which played such a significant role in shaping the 20th century.
This fact alone was enough to ensure Dr. Andrews’ study a place in the history of physical science. But there was another aspect to his paper – a theoretical one – which had equally far-reaching effects and is the subject of the remainder of this post.
– – – –
Dr. Thomas Andrews FRS (1813-1885). Photograph taken in Paris 1875 when Andrews was 62.
Thomas Andrews was a scientist whose experimental skills were evidently comparable to those of the illustrious James Joule. Ten years of care and devotion went into Andrews’ study of the liquefaction of carbon dioxide (called carbonic acid in his day), the essential results of which are contained in this diagram taken from his 1869 paper.

It is a pressure-volume diagram (with the line of no volume to the right) upon which are drawn isothermal carbon dioxide curves for temperatures ranging from 13.1°C to 48.1°C, pressures ranging from 50 to 100 atmospheres. Isothermal air curves are included in the upper left quadrant to illustrate the degree of deviation of the carbon dioxide curves from the rectangular hyperbola associated with ideal gas behavior.
The lowest isothermal curve (13.1°C) shows that at a pressure of around 47 atmospheres, condensation occurs. The compressed gas separates into two distinct coexistent portions – vapor and liquid – along a line of constant pressure, with further compression driving the conversion to the liquid form until finally the whole is converted to liquid, at which point compressibility becomes markedly reduced.
In the next isothermal curve (21.5°C), where condensation takes place at a pressure of about 60 atmospheres, gas and liquid are closer still in density, the liquid occupying nearly a third of the volume of the gas. As James Clerk Maxwell put it in Theory of Heat, written in 1871, “the exceedingly dense gas is approaching in its properties to the exceedingly light liquid”.
These properties eventually coincide at the isopycnic point* (the point of inflexion on the critical isotherm, marked X in the figure below) corresponding to a critical pressure of 72.8 atmospheres and a critical temperature of 31°C.
*isopycnic means ‘of equal density’. The isopycnic point (sometimes called the critical point) is where the densities of vapor and liquid coincide; this occurs under the conditions of critical temperature Tc and critical pressure pc.
Above the critical temperature, isothermals do not show any discontinuity; it is not possible to detect the point at which a liquid becomes a gas or vice versa. If liquid carbon dioxide, represented by point Z in the figure below, is heated at constant pressure until its temperature reaches 48°C, its condition at different temperatures will be represented by the line ZY. At Z the substance concerned is a liquid; at Y it is a gas. The change has taken place smoothly and continuously, representing continuity of state.
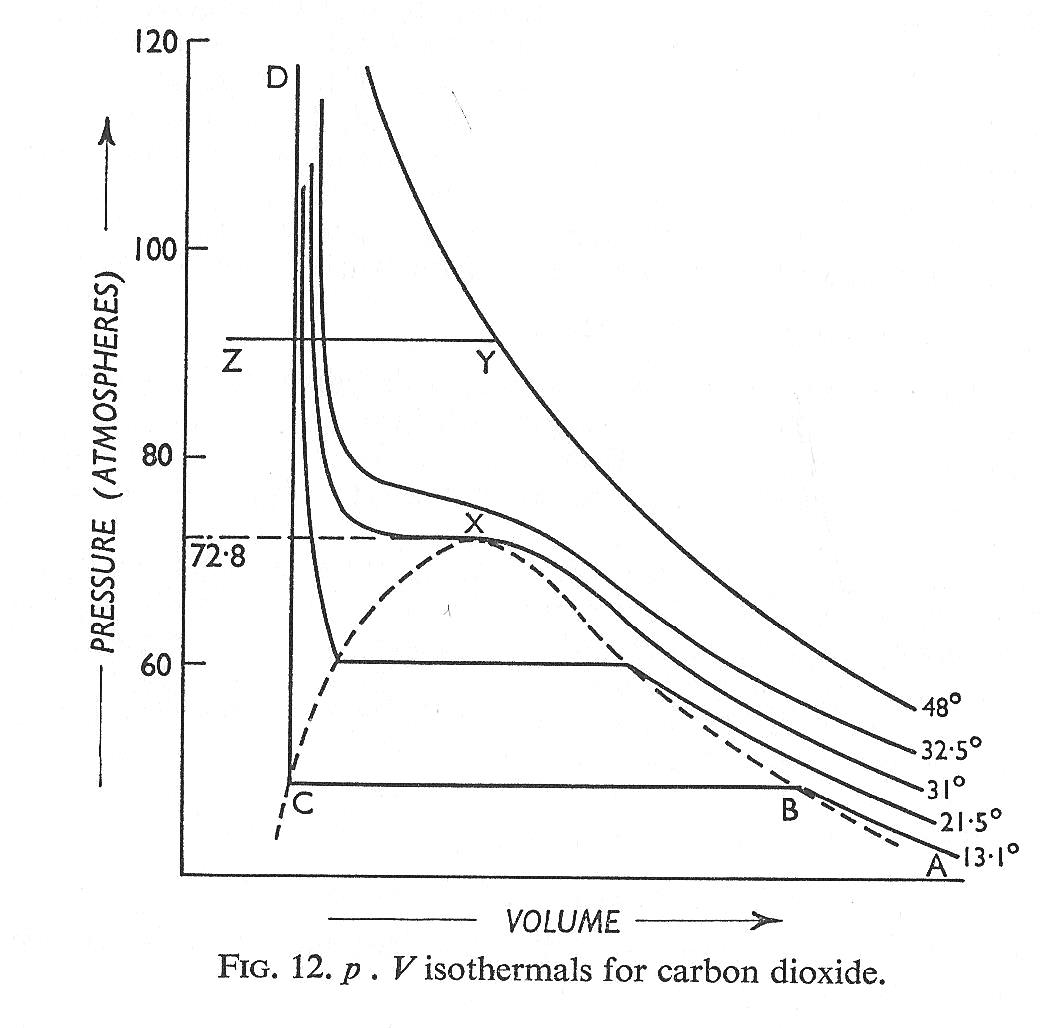
It was this revelation provided by Andrews’ data that started theoreticians thinking about how to reconcile the idea of continuity of state with the discontinuous change observed experimentally within the confines of the dotted parabola shown in Fig.12.
—-
The history of science is full of coincidences – Belfast in Northern Ireland was the birthplace of not only Thomas Andrews, but also William Thomson (later Lord Kelvin) and his elder brother James. William frequently discussed thermodynamics with James, who just happened to be professor of civil engineering at Queen’s College Belfast exactly at the time when Thomas Andrews was conducting his famous experiments there.

James Thomson (1822-1892), physicist and engineer, whose achievements were largely overshadowed by his equally hairy brother William Thomson, also known as Lord Kelvin. Photo credit: Wikipedia
Not surprisingly, James Thomson with his practised skills in thermodynamics took an active interest in Andrews’ remarkable results, and in 1871 proposed a highly original solution to the problem of reconciling the discontinuous isotherms below the isopycnic point with the continuous isotherms above it.
Thomson’s thesis was that the gaseous and liquid parts of a discontinuous isotherm (AB and CD in the above diagram) were only apparently discontinuous, and were actually parts of one smooth curve shown in dotted lines in the diagram below. Every isotherm, according to Thomson, was a continuous curve.

Diagram from “Considerations on the Abrupt Change at Boiling or Condensing in reference to the Continuity of the Fluid State of Matter” by Professor James Thomson, LL.D., Queen’s College, Belfast. Communicated to The Royal Society of London by Dr. Andrews. Received July 4, 1871.
The task that now confronted theoreticians was to find a satisfactory mathematical equation for this curve. Thomson’s curve gave some useful clues, as Lewis and Randall subsequently observed in their classic textbook Thermodynamics and the Free Energy of Chemical Substances:
“It is evident that the equation for such a complete curve must be of odd degree in V, for V increases with diminishing P at both ends of the curve. Furthermore the equation must be of at least the third degree in V, since a certain pressure may correspond to more than one volume. At lower temperatures three roots of the equation are real, at the critical point the three coincide, and at higher temperatures two of them become imaginary.”
The first to provide a solution was a physics student in the Netherlands. His name was Johannes van der Waals.
– – – –

The title page of Johannes van der Waals’ doctoral thesis
At Leiden University on Saturday 14 June 1873, from 12 noon to 3 pm, Johannes van der Waals defended his doctoral thesis, which sought to explain Thomas Andrews experimental results on the basis of kinetic theory, and whose title “Over de Continuiteit van den Gas en Vloeistoftoestand (On the Continuity of the Gaseous and Liquid State)” was almost exactly the same as Andrews’ 1869 paper.
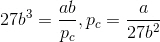
In his thesis, van der Waals introduced the concepts of molecular attraction and molecular volume, and derived the equation of state which bears his name:

where a and b are gas-specific constants related to molecular attraction and molecular volume respectively; the term a/V2 identifies with the derivative (∂U/∂V)T while b turns out to be equal to a third of the critical volume.
Multiplying out the van der Waals equation gives

Since this expression equals zero, it follows that

Multiplying out and rearranging terms

A cubic equation in V is thus obtained. For any given values of p and T, there will be three values of V, since a, b and R are constants for one mole of a given gas.
The cubic form of van der Waals’ equation produces curves like those shown below. They are very similar to the isothermal curves hypothesized by James Thomson (cf. above), and give three values of V along the line of first-order phase transition where all the roots A,B,C are real; on the critical isotherm the roots are coincident at the isopycnic point. At higher temperatures two of the roots become imaginary as the curves become increasingly hyperbolic.

The van der Waals equation of state modifies the ideal gas equation, and is an improvement on it in accounting for the shape of pressure-volume curves above the critical isotherm. At lower temperatures it is also qualitatively reasonable for the liquid state and the low-pressure gaseous state.
During first-order phase transition (A↔C) however, the equation is clearly at variance with the empirically determined fact that the pressure remains constant. The reason why the van der Waals equation fails to describe the behavior of real substances within the dotted region in the above figure is precisely because it assumes continuity of state. It cannot therefore account for the fact that the substance, by separating into two coexistent phases – liquid and saturated vapor – is rendered more stable than in the homogeneous state.
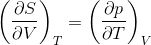
It should be noted that under certain conditions, states corresponding to the portions AA’ and B’C are respectively realizable as superheated liquid and supersaturated vapor (both portions representing states stable with respect to infinitesimal variations but unstable relative to the coexistent liquid-vapor system). The portion of the curve A’B’, on the other hand, represents states that are absolutely unstable since

and according to the energy test of stability in rational mechanics (not to mention common sense), such states where the volume and pressure increase and diminish together are never realizable.
– – – –

Thomas Andrews’ discovery of the critical temperature provided Johannes van der Waals with the starting point for yet further theoretical insight.
It is evident from the van der Waals equation that at the critical temperature, all three values of V are identical. At the isopycnic point (p=pc, V=Vc, T=Tc) the volume V can therefore be set equal to the critical volume Vc, so that

or

The cubic form of the van der Waals equation gives, on dividing terms by pc:

Identifying like terms

Divide the third term by the second term to get Vc:

Substitute Vc in the third term to get pc:
Substitute Vc and pc in the first term to get Tc:

The term a/V2 in the van der Waals equation identifies with the derivative (∂U/∂V)T, since it follows from the fundamental relation of thermodynamics (dU =TdS – pdV) that

Using the Maxwell relation
Hence
 (1)
(1)
Taking the van der Waals equation

and differentiating with respect to temperature at constant volume

Substituting in (1)

The derivative (∂U/∂V)T can be computed from the experimentally determined Joule-Thomson coefficient:

Cp may be obtained calorimetrically or spectroscopically, while (∂V/∂P)T and (∂(PV)/∂P)T can be obtained from data on the compressibility of the gas at constant temperature.
Hence (∂U/∂V)T = a/V2 can be computed for any gas, enabling the constants a and b in the van der Waals equation to be determined. This in turn allows the three critical constants, Vc, pc, Tc, to be calculated.
These critical data – for which van der Waals provided further means of estimation in 1880 with his “principle of corresponding states” – were invaluable in helping Dewar’s determination of the method of liquefying hydrogen (Tc = 33K) in 1898, and Onnes’ determination of the method of liquefying helium (Tc = 5.2K) in 1908.
The van der Waals equation constants a and b also proved useful in the early days of the industrial gases industry. Taking the equation deduced in 1862 by Joule and Thomson for the temperature change ΔT when a gas is subjected to a pressure drop Δp under isenthalpic conditions:

If we apply the van der Waals equation as the equation of state, the Joule-Thomson equation becomes

If a and b become sufficiently small

For most gases the expression in brackets is positive at not-too-high temperatures. A cooling effect is therefore obtained, since Δp is always negative. Carl von Linde, who in 1895 established the first large-scale air liquefaction plant, based the construction of his Joule-Thomson cooling machine on this fact.
It is only when the attractive forces between gas molecules are very small at ordinary temperatures, and thus the constant a becomes minuscule – as is the case for hydrogen and the inert gases helium and neon – that the expression in brackets becomes negative and ΔT becomes positive, i.e. heating occurs. For cooling to occur, the temperature must be lowered below the inversion point, which according to the above equation is

– – – –
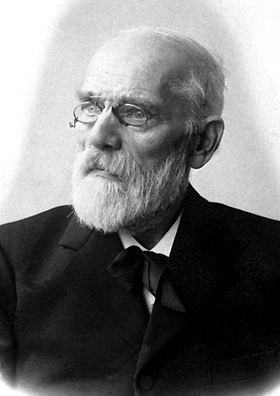
JD van der Waals 1837 – 1923
The Nobel Prize in Physics 1910 was awarded to Johannes Diderik van der Waals “for his work on the equation of state for gases and liquids”.

HK Onnes 1853 – 1926
The Nobel Prize in Physics 1913 was awarded to Heike Kamerlingh Onnes “for his investigations on the properties of matter at low temperatures which led, inter alia, to the production of liquid helium”.
photo credits: nobelprize.org
– – – –
P Mander March 2014

thanks my lord
LikeLike
Thank you for visiting Rob. To me, the historical perspective is just as important as the math and science; it gives vital (and often surprising) insight into how scientific progress – and mistakes – are made.
LikeLike
Can’t pretend to understand the math or science, but still found these two articles quite interesting from a historical perspective.
LikeLike
Reblogged this on nebusresearch and commented:
The CarnotCycle blog has a continuation of last month’s The Liquefaction of Gases, as you might expect, named The Liquefaction of Gases, Part II, and it’s another intriguing piece. The story here is about how the theory of cooling, and of phase changes — under what conditions gases will turn into liquids — was developed. There’s a fair bit of mathematics involved, although most of the important work is in polynomials. If you remember in algebra (or in pre-algebra) drawing curves for functions that had x3 in them, and in finding how they sometimes had one and sometimes had three real roots, then you’re well on your way to understanding the work which earned Johannes van der Waals the 1910 Nobel Prize in Physics.
LikeLike